[SAP BTP Chronicles #1] Logging in CAP framework
The December release of the CAP framework brought a change in the logging mechanism. Let's look at the entry:
To understand all the changes, let's go through the topics discussed in this note one by one and examine the logging mechanism at various levels - locally in the terminal, in the logs of our service in BTP, and through the SAP Application Logs service.
Sample Application
Let's start with a mini-project to produce some logs.
cds init sample-logging
cd sample-logging
npm install
Since this is a simplified example, for the deployed application, I will also use SQLite -
so in the generated package.json, I move the dependency "@cap-js/sqlite": "^1", from
devDependencies to dependencies.
Next, I added a very simple logic based on one entity, a simple service, and
two entries in the csv file. I also added a function that returns an
error when attempting to retrieve data for the name and surname Kate Doe - this
is just a shortcut to trigger and simulate some business logic error and we will need it later.
db/model.cds
using { cuid } from '@sap/cds/common';

namespace sample.model;

entity Names : cuid {
  @mandatory name: String(50);
  @mandatory lastname: String(200);
}
srv/service.cds
using sample.model as model from '../db/model';

service NamesSevice {
  entity MyNames as projection on model.Names;
}
db/data/sample.model-Names.csv
ID;name;lastname
842fe729-4077-4190-940b-54e33cfdd77d;John;Doe
a7aa1b2d-7514-41dc-82bf-91af2ba67cc1;Kate;Smith
service.js
const cds = require("@sap/cds");
const LOG = cds.log("my-service");

class NamesService extends cds.ApplicationService {
  init() {
    const { MyNames } = this.entities;

    this.before("READ", MyNames, (req) => {
      LOG.info("👽 this is my info");

      if (req.id === "a7aa1b2d-7514-41dc-82bf-91af2ba67cc1") {
        LOG.error("👻 service logic error");
        req.reject("you can't read this entity");
      }
    });

    return super.init();
  }
}

module.exports = NamesService;
I added the server.js file with the implementation in the served event so
that some log would be visible already at the start of the application.
const cds = require("@sap/cds");
const LOG = cds.log("my-server");

cds.on("served", (services) => {
  LOG.info("🕺served!");
});
To keep the example simple, we set SQLite as the default database and finally enable
the logging format, which was the default before version 7.5 without the configuration set
kibana_formatter: true - that is, plain.
.cdsrc.json
{
  "cds": {
    "requires": {
      "db": {
        "kind": "sqlite",
        "impl": "@cap-js/sqlite",
        "credentials": {
          "url": ":memory:"
        }
      },
      "auth": "dummy"
    },
    "features": {
      "in_memory_db": true
    },
    "log": {
      "format": "plain"
    }
  }
}
"Plain" Logging
Terminal
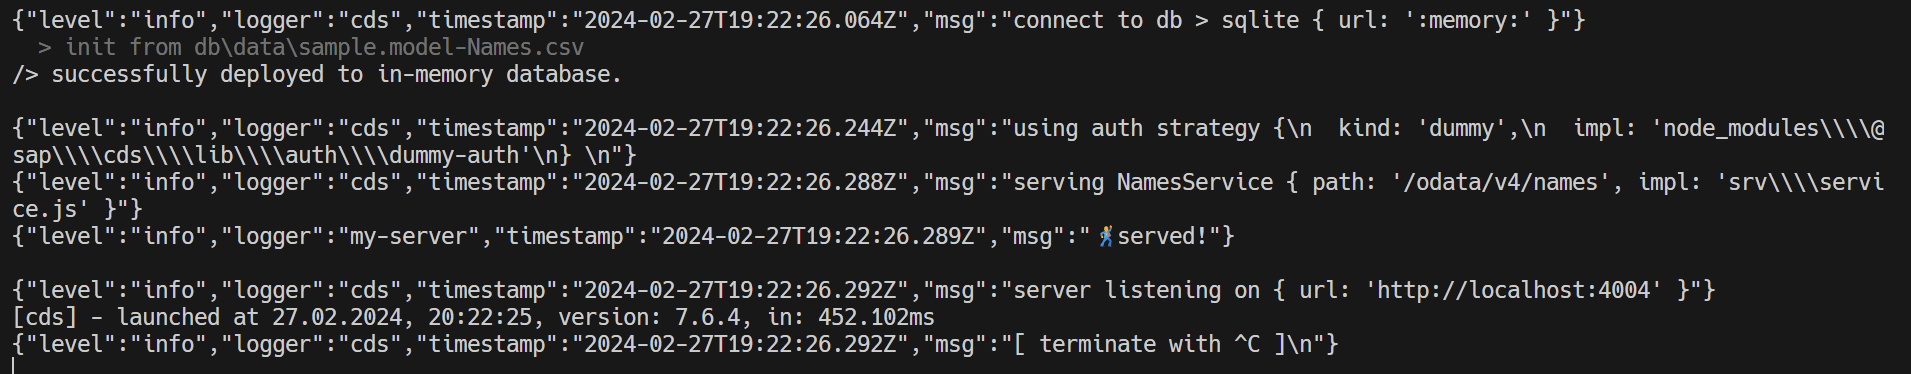
Let's see how our plain settings look in the terminal. After running with cds serve:
...
[cds] - connect to db > sqlite { url: 'memory' }
[cds] - using auth strategy {
  kind: 'dummy',
  impl: 'node_modules\\@sap\\cds\\lib\\auth\\dummy-auth'
}

[cds] - serving NamesSevice { path: '/odata/v4/names-sevice' }
[my-server] - 🕺served!

[cds] - server listening on { url: 'http://localhost:4004' }
[cds] - launched at 25.02.2024, 22:24:33, version: 7.6.4, in: 412.394ms
[cds] - [ terminate with ^C ]
So we have nicely formatted logs line by line, and our log from the server.js file is also there.
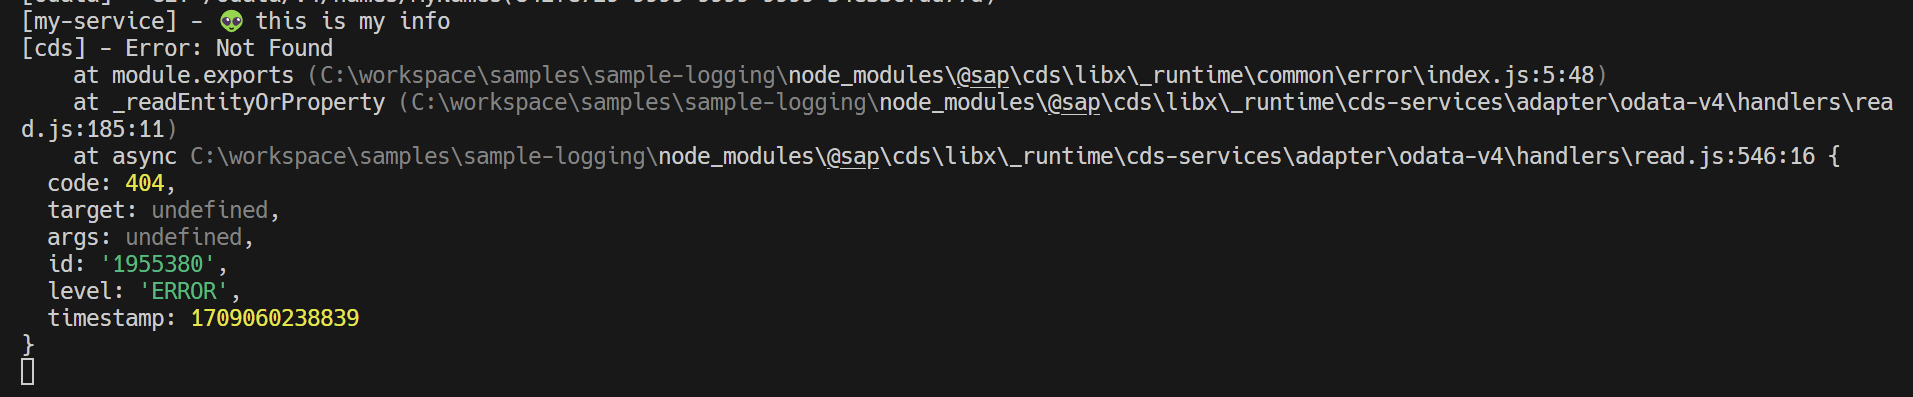
Let's make some error - for example, trying to retrieve something that doesn't exist:
Let's also look at a business logic error - attempting to retrieve an entry with the ID Kate:
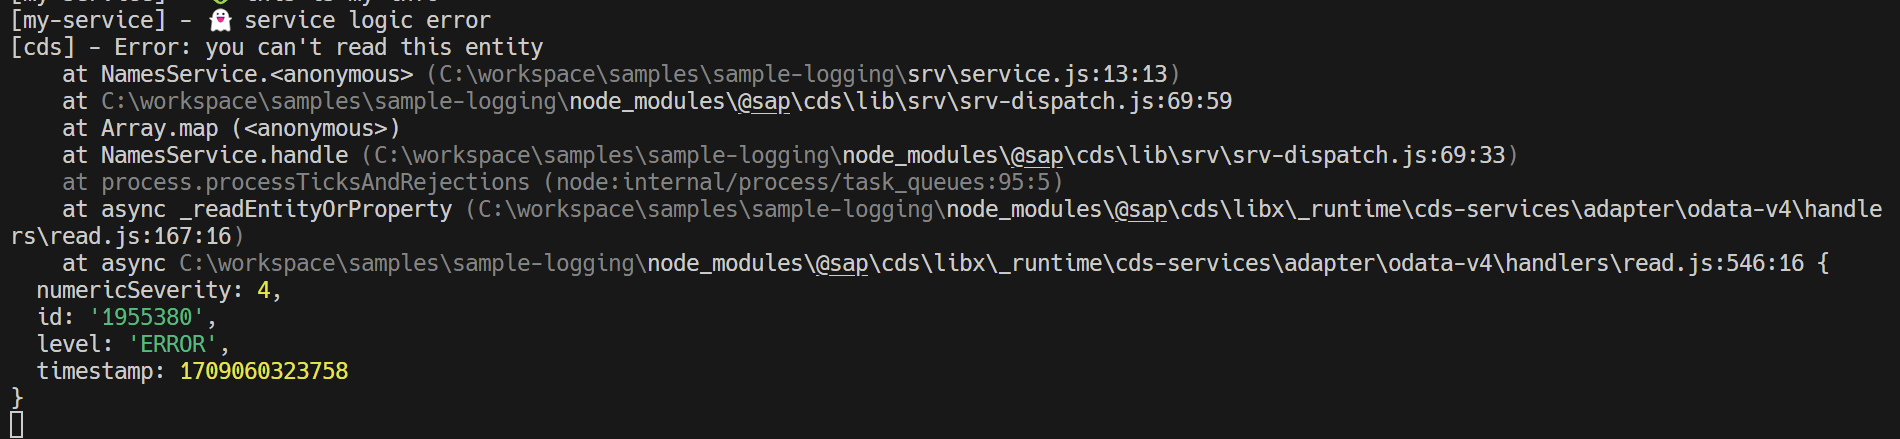
Everything is nicely line by line, our logger is marked as we defined it in the code -
[my-service], the remaining framework loggers have their names like [cds], [odata], etc.
BTP Logs
Now let's see how our logs look in the instance of our service in SAP BTP.
Before that, we add configuration (simplified) for deployment - we only add MTA with the command
cds add mta. Then we can build the application - I previously add mbt locally
(npm i -D mbt), then npx mbt build. Finally, I log in to my Cloud Foundry environment
in BTP and deploy - cf deploy mta_archives/sample-logging_1.0.0.mtar.
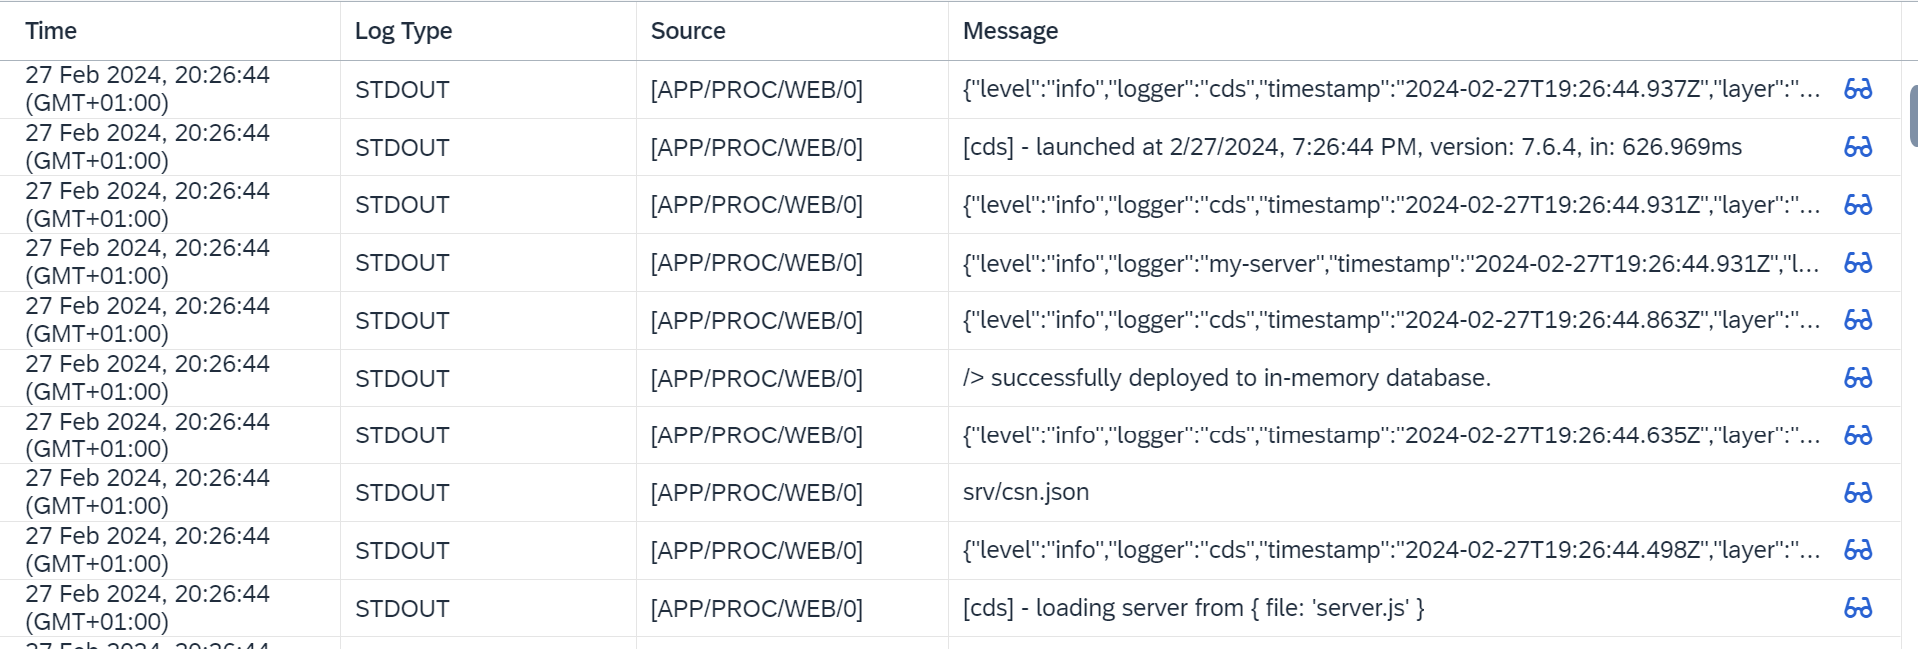
After successful deployment, we go to the instance of our service, the Logs tab.
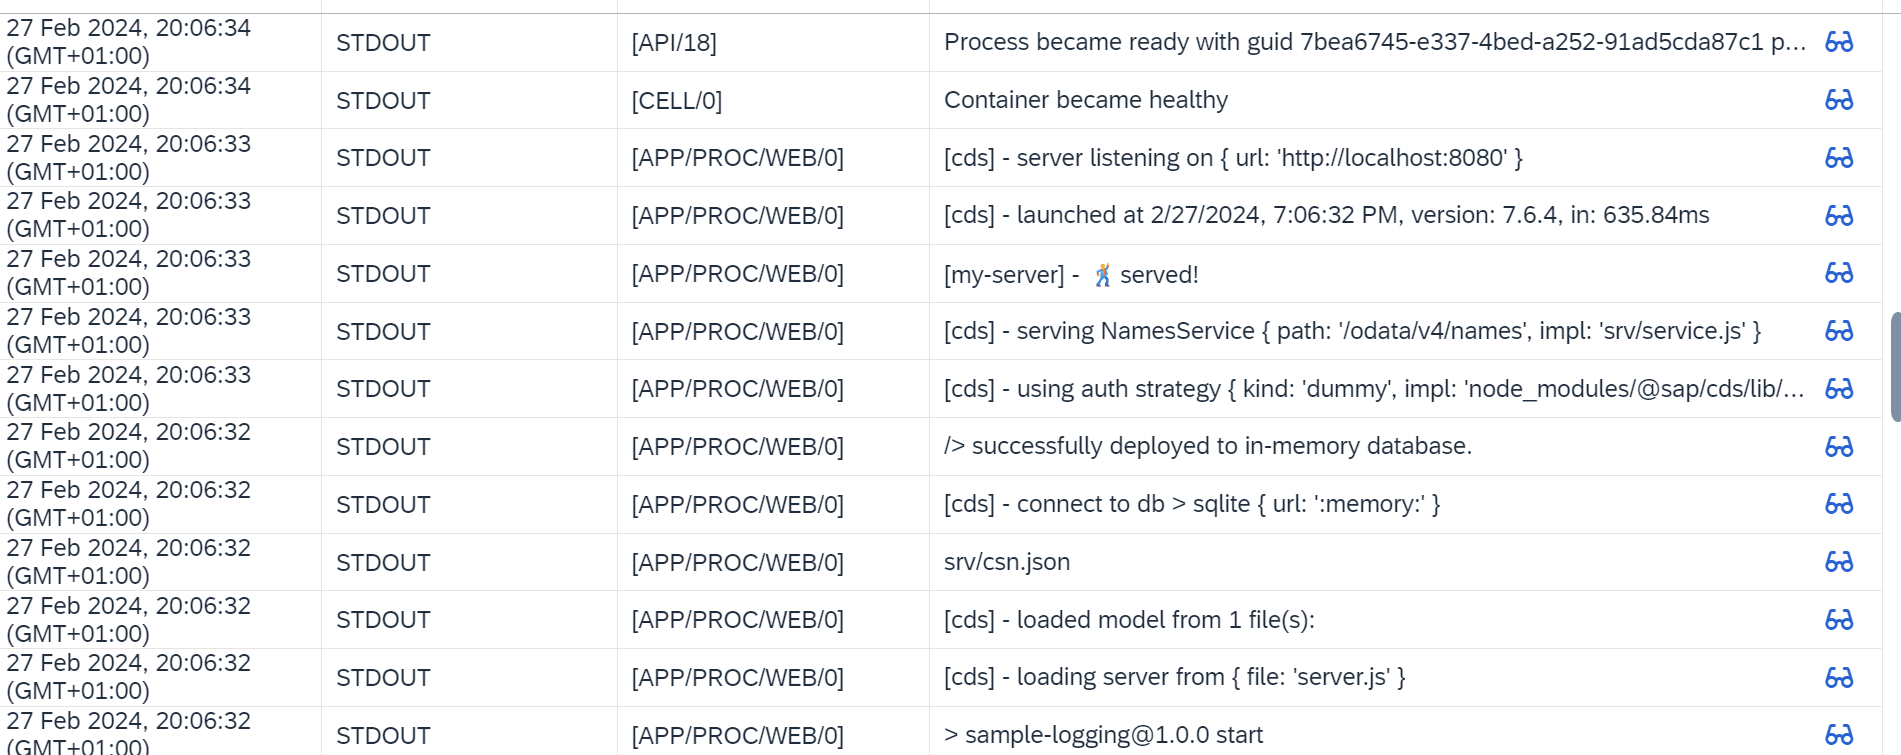
Each log line from the terminal is now a separate row in the table. This time we also
have information about the source - columns Log Type and Source.
Let's see how our stupid business logic error will look like, i.e.,
for the deployed application, I will try to call GET for Kate Doe.
I get an error message in the browser:
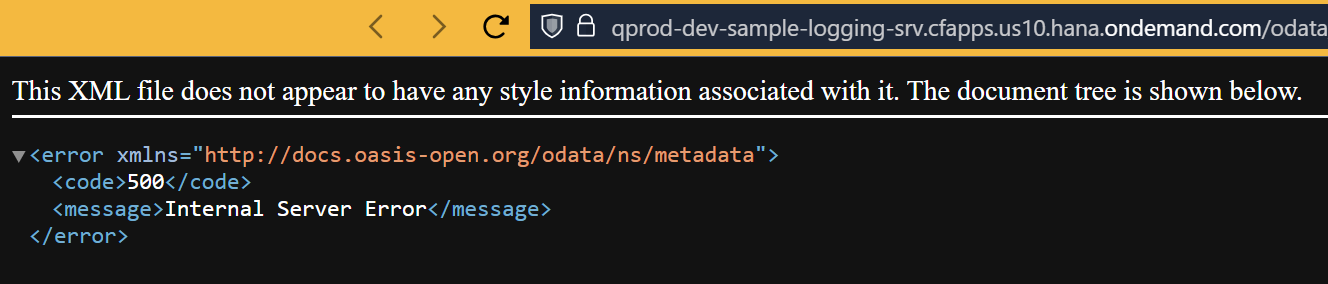
and in the BTP logs:
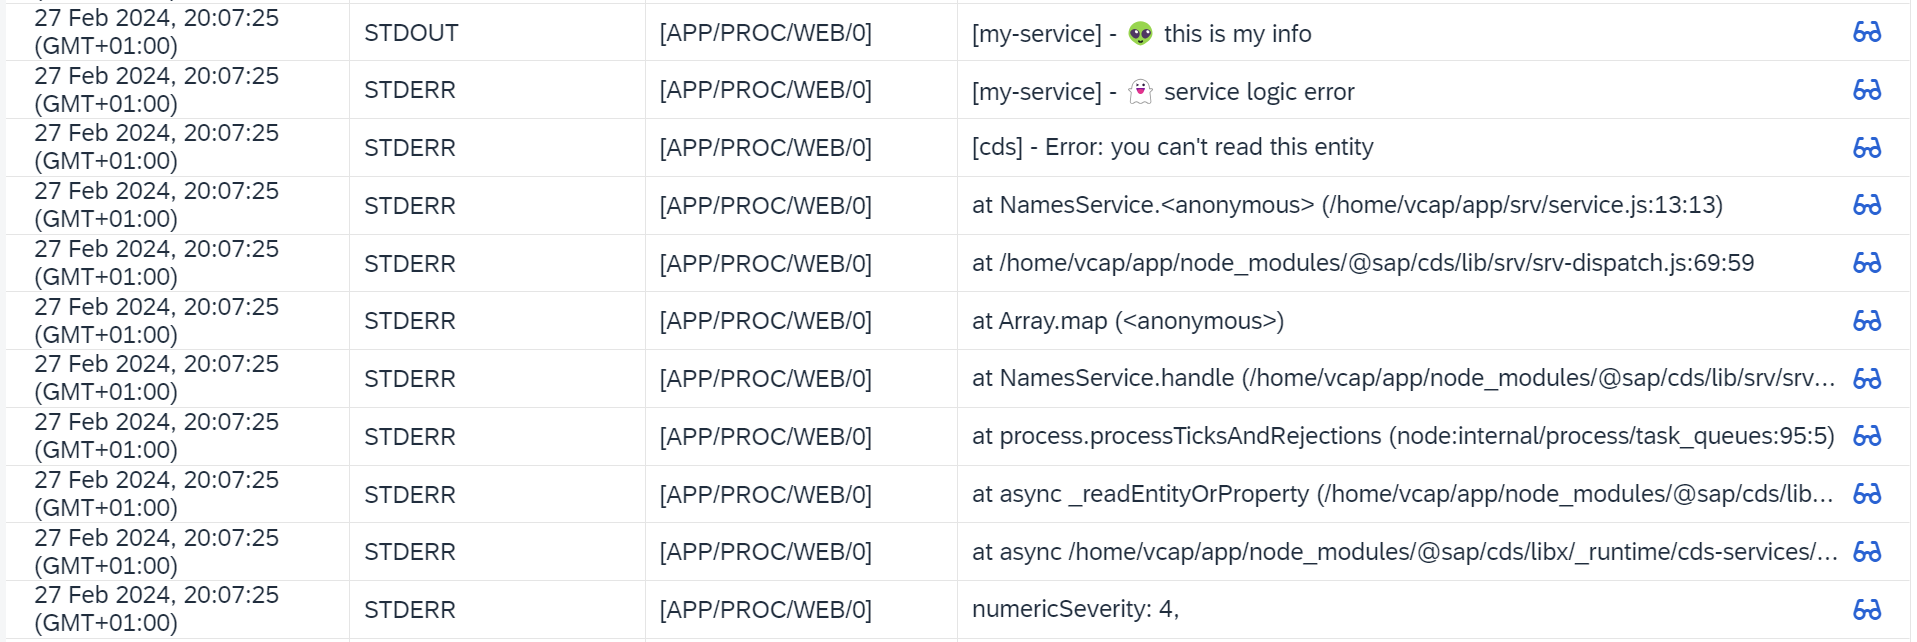
Again, we have everything line by line (compare with the error in the terminal).
This time Log Type is STDERR.
Let's also see how two logging entries look, which for a reminder in the code look like this:
...
this.before("READ", MyNames, (req) => {
  LOG.info("👽 this is my info");

  if (req.data.ID === "a7aa1b2d-7514-41dc-82bf-91af2ba67cc1") {
    LOG.error("👻 service logic error");
    req.reject("you can't read this entity");
  }
});
...
and in BTP:

LOG.error reached us through STDERR, while LOG.info - STDOUT.
SAP Application Logs
We add an instance of the SAP Application Logs service.
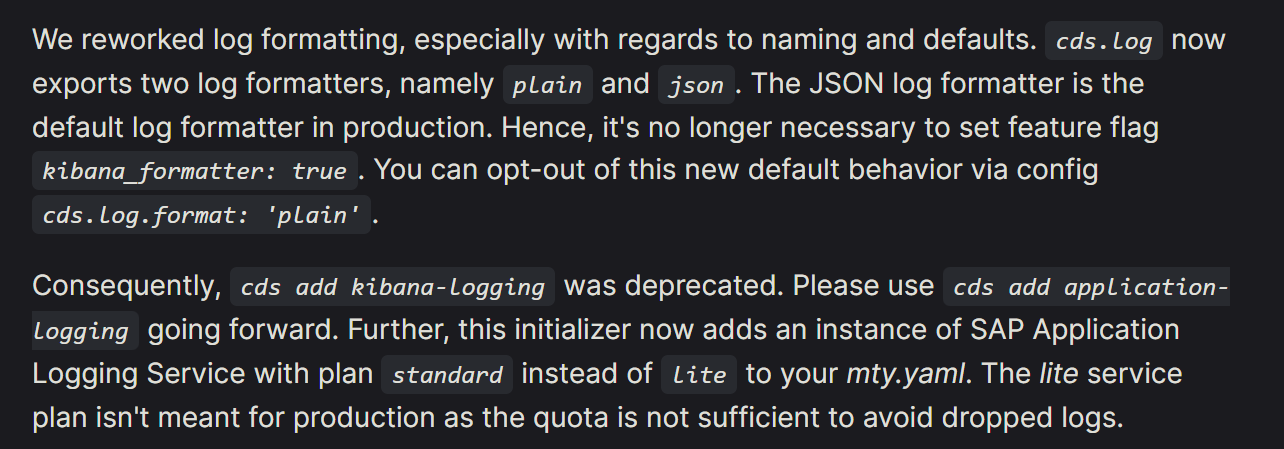
Now attention - up to version 7.5 there was a command for this cds add kibana-logging, but now we have
cds add application-logging. Why? Because until a certain point, SAP Application Logging was based on
the ELK stack - Kibana for visualization + Elasticsearch underneath. However, currently in this service
we have OpenSearch Dashboards + OpenSearch - OSS forks of predecessors.
By the way - this shows that it is not worth using technical names for functionalities that are long-term; an abstract name is always better and will last longer, technologies change quite quickly nowadays.
Okay, after adding logging, we have an additional entry in mta.yaml - I only change
the plan to free lite and rebuild & redeploy the application.
Remember that the logging format set in the cdsrc.json file is not preceded by a profile
[development], [production] etc. - so for SAP Application Logs, the format plain will still be used.
On the page of our application in BTP, we can go to OpenSearch (by the way, the button is still called Kibana):
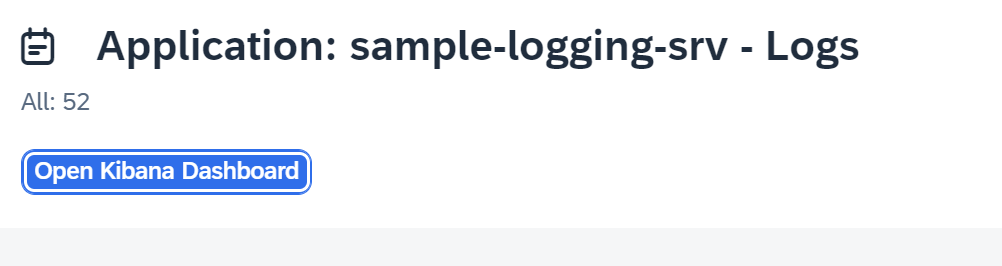
We land on the OpenSearch page and look for logs from our CAP service:
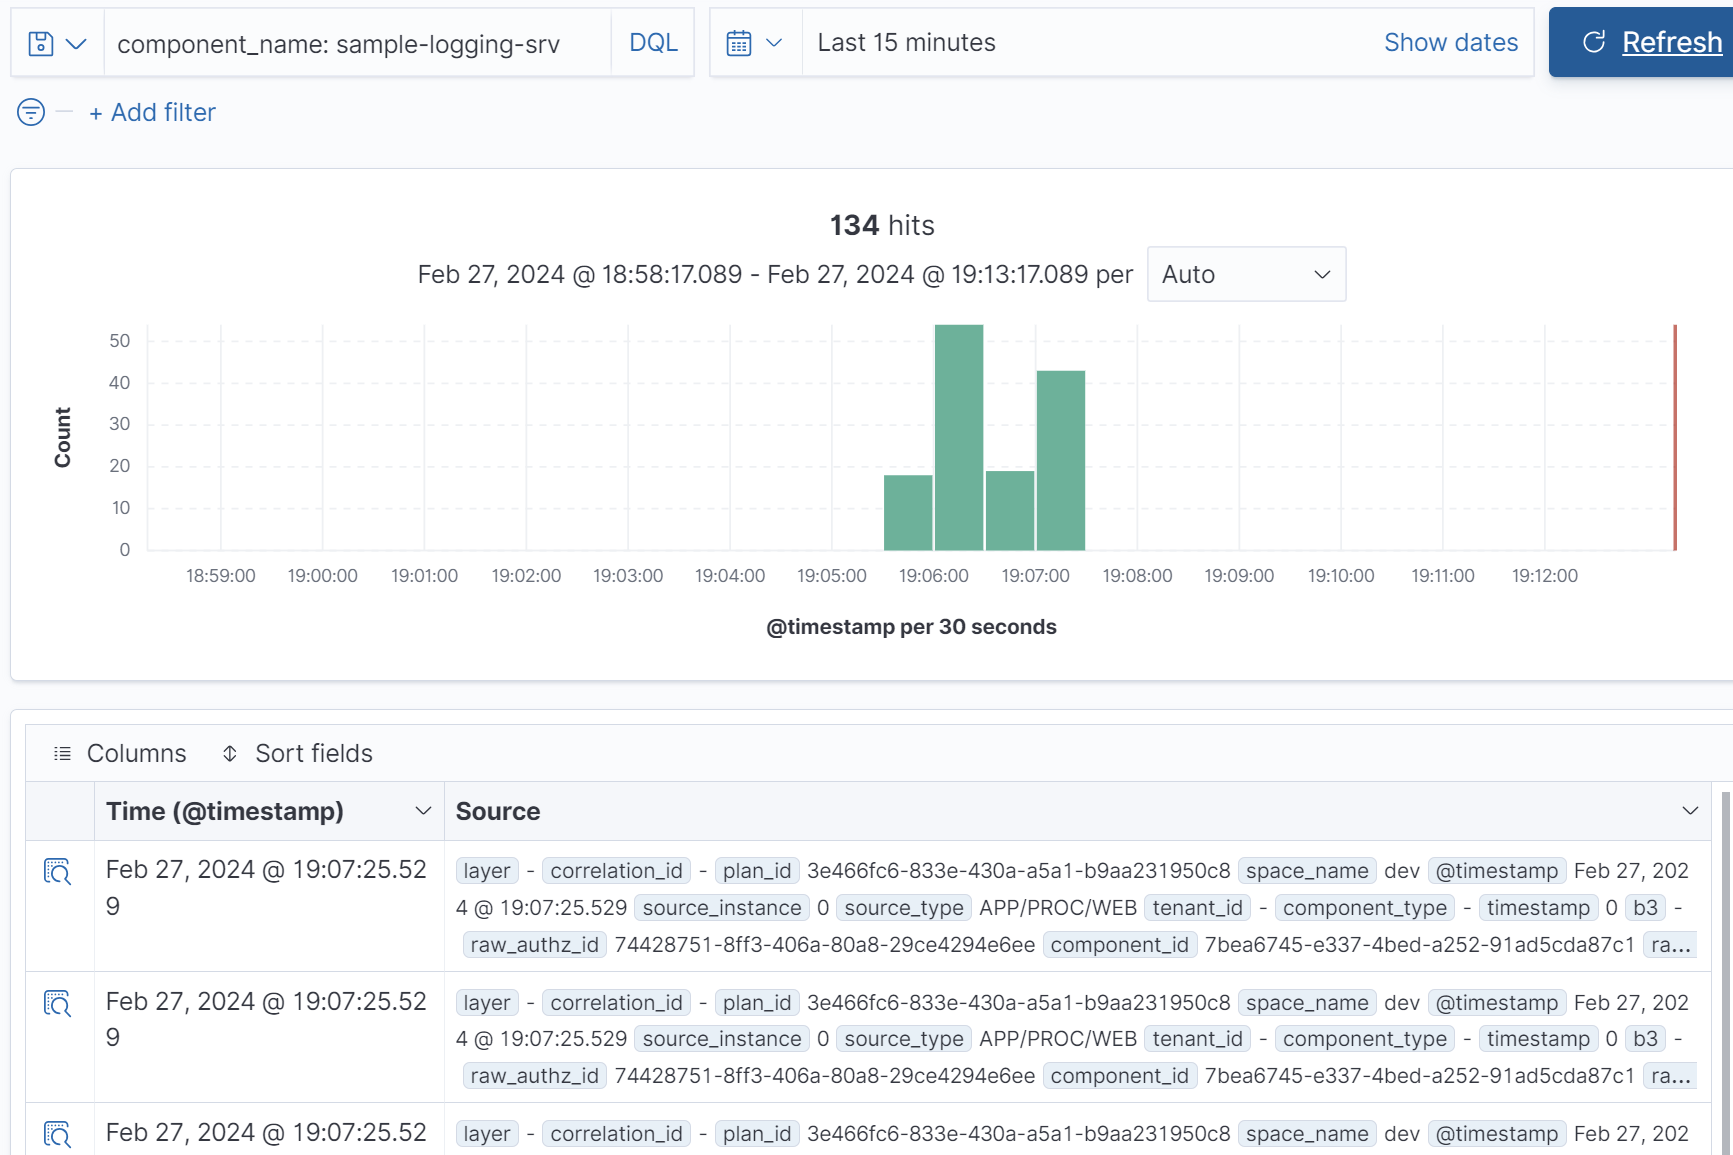
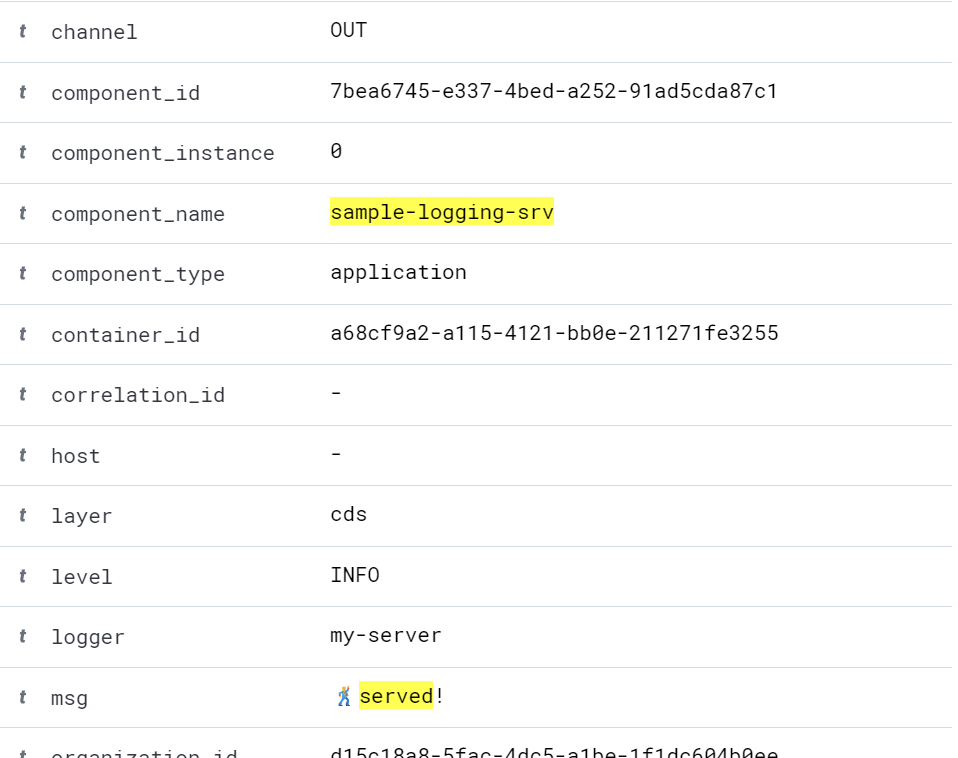
Each line of our log this time is a separate document with a lot of additional information.
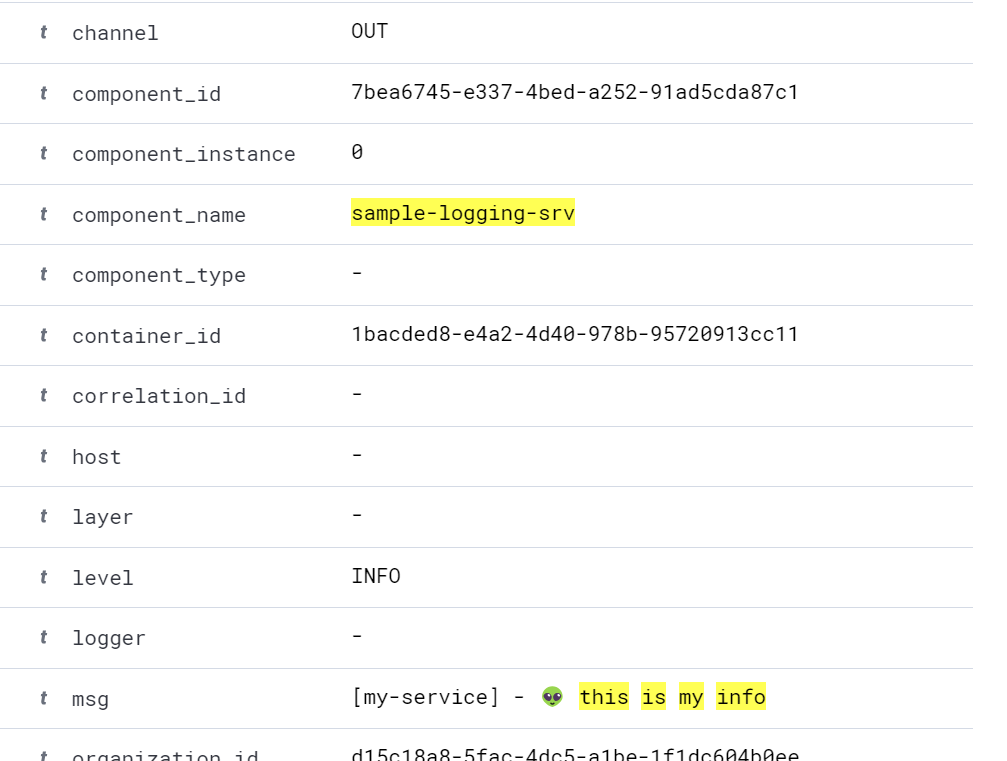
Let's see for example our LOG.info entry:
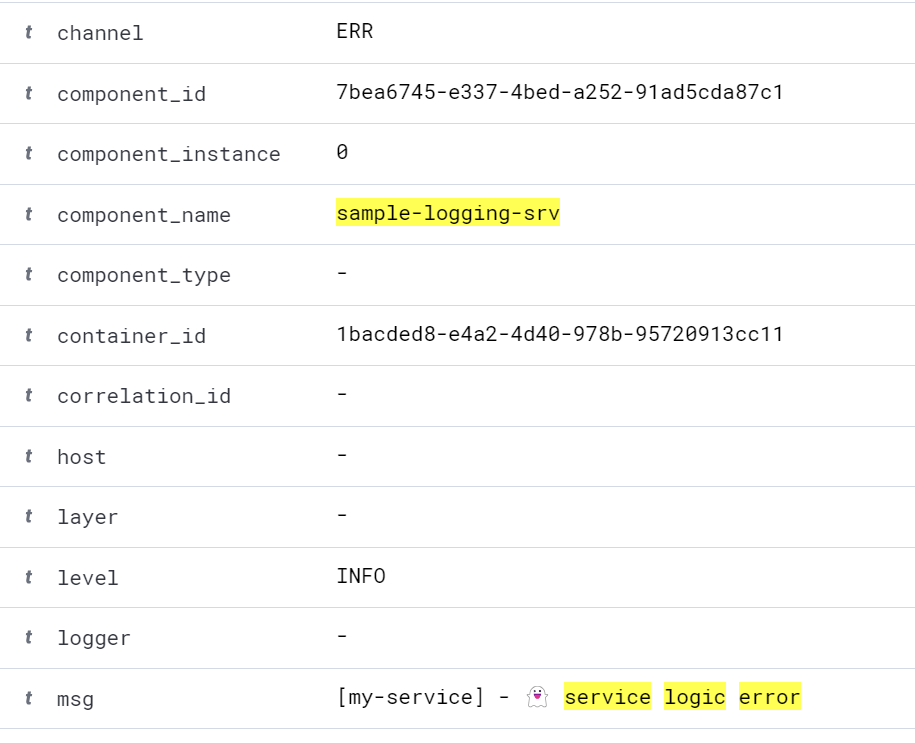
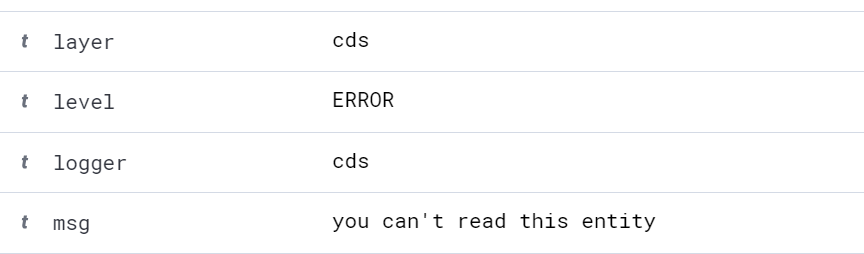
and LOG.error:
As you can see, the documents have additional fields, much more than in the instance logs in BTP.
Similarly to there - LOG.info went through the OUT channel and LOG.error - ERR.
The name of our logger my-service is not included in any field - only as text
in msg. It is also worth noting that some fields are empty.
For our short logging entries, let's say it's not a tragedy, but let's see how the logs look like for our logic error - for a reminder in the terminal we had it like this:
And how is it in OpenSearch? Well, each line e.g. the stack trace is "split" into separate JSON documents!
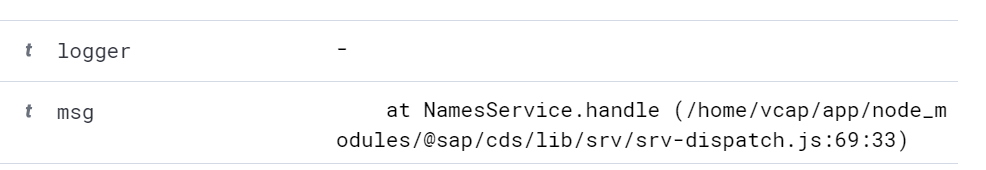
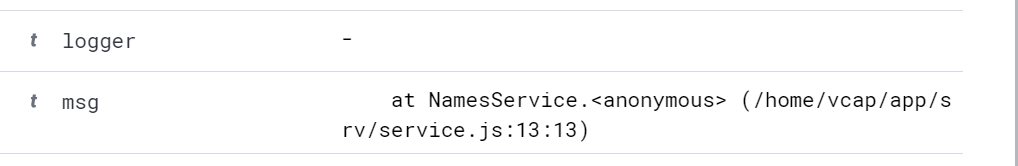
etc.
This is not very convenient...
We already have an overview of how it looks with the plain format on all levels, let's see
what will change when we switch to json.
"json" Logging
I force the json format through the cdsrc.json file by changing the appropriate value:
...
"log": {
  "format": "json"
}
...
Terminal
Now let's start the application and right from the start we see a change:
As you can see, each log entry is JSON - what was previously output as a nice line, now it is much less readable.
Logi w BTP
Let's see how things look in the logs of the instance in BTP. Rebuild & redeploy and go to the Logs tab:
So similar to the terminal - logs from the framework as JSON documents are displayed as rows.
SAP Application Logs
Let's see how the logs look in OpenSearch - let's take for example an entry from LOG.info:
Similar to the plain format, our log entry is a document, but this time
we have many more filled fields. Finally, our logger my-service is also
correctly added as logger.
What does this give us? Well, better query capabilities - but that's a topic for another post.
Let's see how our logic error looks like - previously the whole stack trace was split into separate JSON documents.
And at the bottom of our error document, we have the stacktrace field:
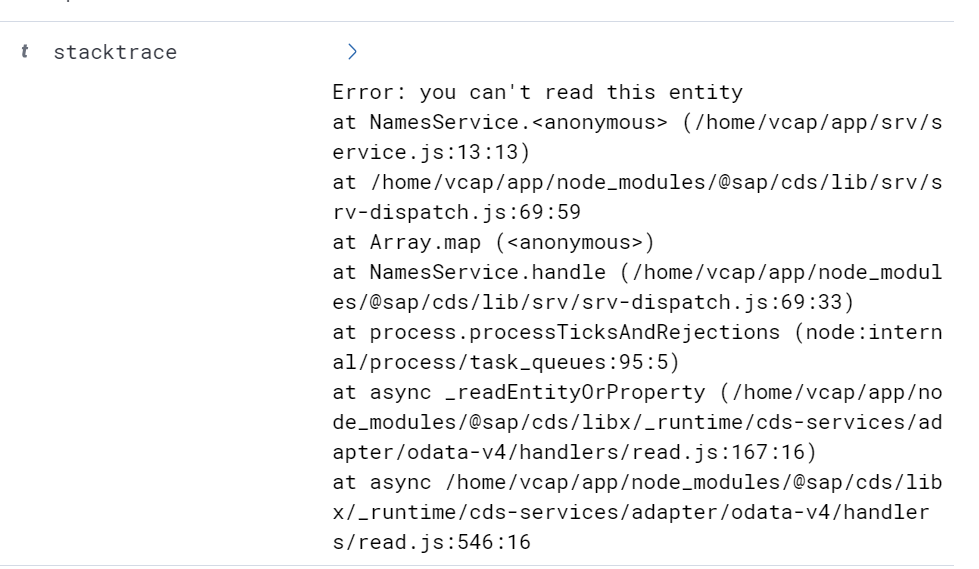
where everything is neatly in one place.
Conclusion
JSON logging gives us better capabilities in OpenSearch and a more readable aggregation
of information, but it's crappy in the terminal. That's why from version 7.5
the default logging is plain for environments != production and json for production.
Production Logging Documentation
BUT if you won't be using SAP Application Logging (the lite plan is free, but the
others suitable for production use are not) then it's better to set logging to
plain - at least form me they are more readable in the BTP logs.
And finally - we already have a successor to SAP Application Logging - SAP Cloud Logging, but that's also a topic for another post.
I the next episode we will query some logs in OpenSearch Dashboard.


